Key Performance Indicators
This page is work in progress and full KPI reporting will be in place here early 2026. In the meantime summaries are available on the Biodiversity Dashboard.
How the the Key Performance Indicators are calculated is here
Biodiversity
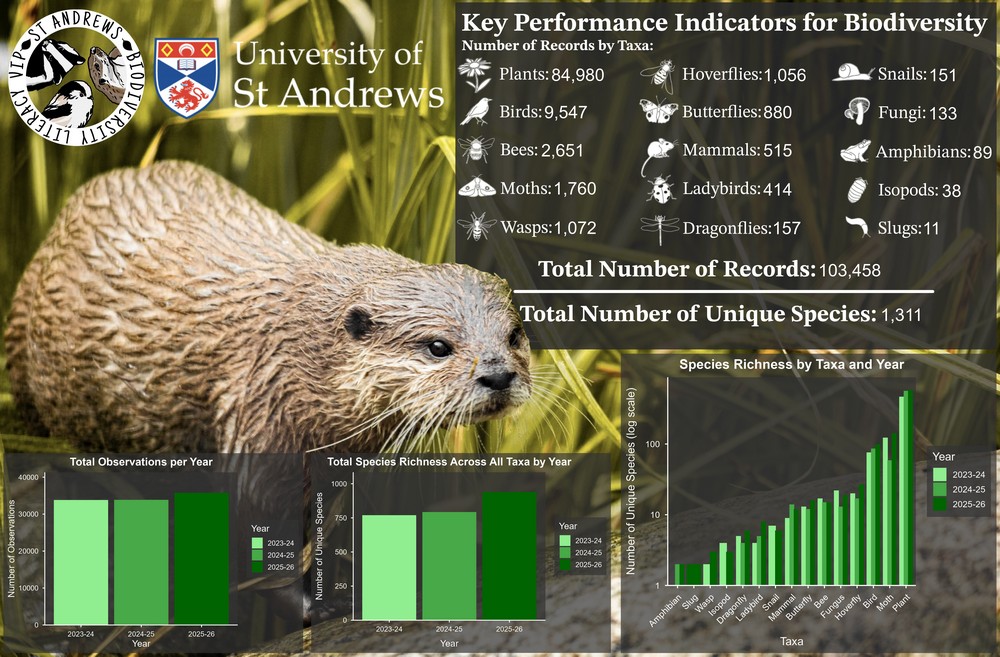
Biodiversity Net Gain – to increase the species richness and abundance of native plants, fungi and animals on the University Estate.
(Up to October 1st 2025)
Habitats
Establish a nature positive estate, with the majority of our land (>60%) contributing towards our biodiversity strategies by 2035
(Up to end 2024)
